An official website of the United States government
An official website of the United States government
The .gov means it's official.
Federal government websites often end in .gov or .mil. Before sharing sensitive information,
make sure you're on a federal government site.
The site is secure.
The
https:// ensures that you are connecting to the official website and that any
information you provide is encrypted and transmitted securely.

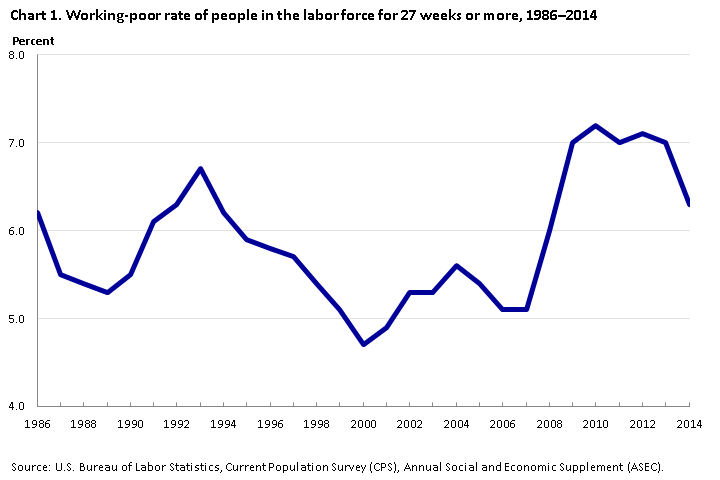
In 2014, according to the U.S. Census Bureau, about 46.7 million people, or 14.8 percent of the nation’s population, lived below the official poverty level.1 (See the technical notes section for examples of poverty levels.) Although the poor were primarily children and adults who had not participated in the labor force during the year, according to data from the Bureau of Labor Statistics, 9.5 million individuals were among the “working poor” in 2014; this measure was down from 2013. The working poor are people who spent at least 27 weeks in the labor force (that is, working or looking for work) but whose incomes still fell below the official poverty level. In 2014, the working-poor rate—the ratio of the working poor to all individuals in the labor force for at least 27 weeks—was 6.3 percent, down by 0.7 percentage point from the previous year’s figure. (See table A and 1 and chart 1.)
Following are additional highlights from the 2014 data:
| Characteristic | 2007 | 2008 | 2009 | 2010 | 2011 | 2012 | 2013 | 2014 |
|---|---|---|---|---|---|---|---|---|
| Total in the labor force1 | 146,567 | 147,838 | 147,902 | 146,859 | 147,475 | 148,735 | 149,483 | 150,319 |
In poverty | 7,521 | 8,883 | 10,391 | 10,512 | 10,382 | 10,612 | 10,450 | 9,487 |
Working poor rate | 5.1 | 6.0 | 7.0 | 7.2 | 7.0 | 7.1 | 7.0 | 6.3 |
| Unrelated individuals | 33,226 | 32,785 | 33,798 | 34,099 | 33,731 | 34,810 | 35,061 | 35,018 |
In poverty | 2,558 | 3,275 | 3,947 | 3,947 | 3,621 | 3,851 | 4,141 | 3,395 |
Working poor rate | 7.7 | 10.0 | 11.7 | 11.6 | 10.7 | 11.1 | 11.8 | 9.7 |
| Primary families2 | 65,158 | 65,907 | 65,467 | 64,931 | 66,225 | 66,541 | 66,462 | 66,732 |
In poverty | 4,169 | 4,538 | 5,193 | 5,269 | 5,469 | 5,478 | 5,137 | 5,108 |
Working poor rate | 6.4 | 6.9 | 7.9 | 8.1 | 8.3 | 8.2 | 7.7 | 7.7 |
1Includes individuals in families, not shown separately. 2Primary families with at least one member in the labor force for more than half the year. Note: Updated population controls are introduced annually with the release of January data. Source: U.S. Bureau of Labor Statistics, Current Population Survey (CPS), Annual Social and Economic Supplement (ASEC). | ||||||||
This report presents data on the relationship between labor force activity and poverty status in 2014 for workers and their families. These data were collected in the 2015 Annual Social and Economic Supplement to the Current Population Survey. (For a detailed description of the source of the data and an explanation of the concepts and definitions used in this report, see the technical notes at the end of this report.) The specific income thresholds used to determine people’s poverty status vary, depending on whether the individuals are living with family members or are living alone or with nonrelatives. For family members, the poverty threshold is determined by their family’s total income; for individuals not living in families, their personal income is used as the determinant.
Among those who were in the labor force for 27 weeks or more in 2014, the number of women classified as working poor (5.1 million) was higher than that of men (4.4 million). Similarly, the working poor rate continued to be higher for women (7.2 percent) than for men (5.5 percent). The working poor rates for both women and men were down from a year earlier. (See table 2).
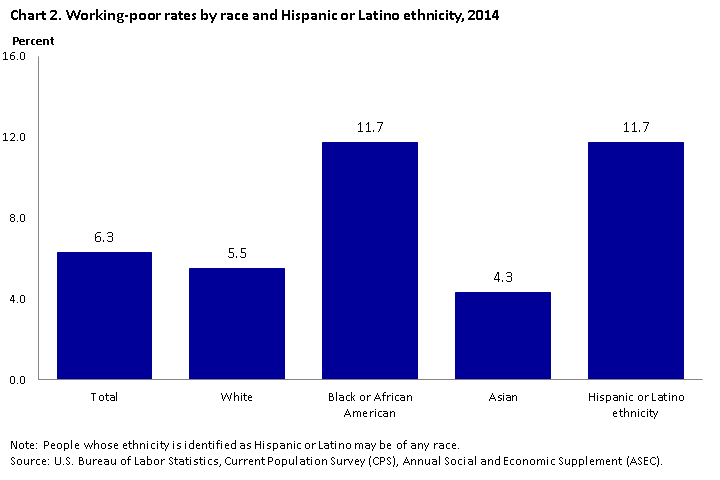
Blacks and Hispanics were more than twice as likely as Whites and Asians to be among the working poor. In 2014, the working-poor rates of Blacks and Hispanics were both 11.7 percent, compared with 5.5 percent for Whites and 4.3 percent for Asians. (See chart 2 and table 2.)
Among Whites, Blacks, and Hispanics, the working-poor rate was higher for women than for men. The rates for White women and men who spent at least 27 weeks in the labor force were 5.9 percent and 5.1 percent, respectively. The rate for Black women was 14.6 percent, compared with 8.4 percent for Black men. Hispanic women and men had rates of 12.6 percent and 11.1 percent, respectively. Among Asians, the rates for women and men were little different from each other.
Young workers are more likely to be poor than are workers in older age groups, in part because earnings are lower for young workers, and the unemployment rate for young workers is higher. Among youths who were in the labor force for 27 weeks or more, 10.4 percent of 16- to 19-year-olds and 12.1 percent of 20- to 24-year-olds were living in poverty in 2014, considerably higher than the rate for workers age 35 to 44 (6.7 percent). Workers age 45 to 54, 55 to 64, and those age 65 and older had lower working-poor rates—4.8 percent, 3.3 percent, and 2.0 percent, respectively—than did the younger age groups.
Achieving higher levels of education reduces the incidence of living in poverty. Individuals who complete more years of education usually have greater access to higher paying jobs—such as management, professional, and related occupations—than those with fewer years of education. Of all the people in the labor force for 27 weeks or more in 2014, those with less than a high school diploma had a higher working-poor rate (18.3 percent) than did high school graduates with no college (8.3 percent). Workers with an associate’s degree and those with a bachelor’s degree or higher had the lowest working-poor rates (4.6 percent and 2.0 percent, respectively). In 2014, at nearly all levels of educational attainment, women were more likely than men to be among the working poor; by race and ethnicity, Blacks and Hispanics generally were more likely to be among the working poor than were Whites and Asians. (See table 3.)
The likelihood of being among the working poor varies widely by occupation. Workers in occupations requiring higher education and characterized by relatively high earnings—such as management, professional, and related occupations—were least likely to be classified as working poor, 1.9 percent in 2014. By contrast, individuals employed in occupations that typically do not require high levels of education and are characterized by relatively low earnings were more likely to be among the working poor. For example, 12.8 percent of service workers who were in the labor force for at least 27 weeks were classified as working poor in 2014. Indeed, service occupations, with 3.2 million working poor, accounted for 37 percent of all those classified as working poor. Among those employed in natural resources, construction, and maintenance occupations, 7.9 percent of workers were classified as working poor. Within this occupation group, 16.8 percent of workers employed in farming, fishing, and forestry occupations were among the working poor. (See table 4.)
In 2014, the number of families living below the poverty level (5.1 million), despite having at least one member in the labor force for half the year or more, was unchanged from last year’s figure. Among families with only one member in the labor force for at least 27 weeks in 2014, married-couple families had a lower likelihood of living below the poverty level (9.3 percent) than did families maintained by women (26.1 percent) or by men (15.2 percent). (See table 5.)
Among families with at least one member in the labor force for more than half the year, those with children in the household were much more likely to live below the poverty level than those without children. The proportion of families with children under age 18 that lived in poverty was 12.1 percent, compared with 2.7 percent for families without children. Among families with children under 18, the working-poor rate for those maintained by women (27.2 percent) was higher than that for those maintained by men (16.0 percent). Married-couple families with children under 18 had a working-poor rate of 6.8 percent in 2014.
The “unrelated individuals” category includes individuals who live by themselves or with others not related to them. Of the 35.0 million unrelated individuals who were in the labor force for half the year or longer, 3.4 million lived below the poverty level in 2014, a decrease from last year’s figure. The working-poor rate for unrelated individuals was 9.7 percent, down from 11.8 percent a year earlier. (See table 6.)
Within the group of unrelated individuals, teenagers continued to be the most likely to be among the working poor. In 2014, the working-poor rate was 36.5 percent for teens who were in the labor force for 27 weeks or more and who lived on their own or with others not related to them. Overall, the rate for men living alone or with nonrelatives (8.7 percent) was lower than the rate for women (11.0 percent). The working-poor rates for unrelated individuals were 13.9 percent for Hispanics, 13.7 percent for Blacks, 9.0 percent for Whites, and 6.3 percent for Asians. (See table 7.)
Of the 3.4 million unrelated individuals considered to be among the working poor in 2014, about three-fifths lived with others. These individuals had a much higher working-poor rate than individuals who lived alone (12.3 percent and 7.3 percent, respectively). Many unrelated individuals living below the poverty level may live with others out of necessity. Conversely, many of those who live alone do so because they have sufficient income to support themselves. Unrelated individuals’ poverty status, however, is determined by each person’s resources. The pooling of resources and sharing of living expenses may permit some individuals in this category—who are technically classified as poor—to live at a higher standard than they would have if they lived alone.
As noted earlier, people who usually work full time are less likely to live in poverty than are those who work part time, yet there remains a sizable group of full-time workers who live below the poverty threshold. Among those who participated in the labor force for 27 weeks or more and usually worked in full-time wage and salary jobs, 4.4 million, or 3.8 percent, were classified as working poor in 2014—little changed from a year earlier. (See table 8.)
There are three major labor market problems that can hinder a worker’s ability to earn an income above the poverty threshold: low earnings, periods of unemployment, and involuntary part-time employment. (See the technical notes for detailed definitions.)
In 2014, 82 percent of the working poor who usually worked full time experienced at least one of the major labor market problems. Low earnings continued to be the most common problem, with 67 percent subject to low earnings, either as the major problem or in combination with other labor market problems. About 32 percent experienced unemployment as the main labor market problem or in conjunction with other problems. Four percent of the working poor experience all three problems: low earnings, unemployment, and involuntary part-time employment.
Some 819,000, or 18 percent, of the working poor who usually worked full time did not experience any of the three primary labor market problems in 2014. Their classification as working poor may be explained by other factors, including short-term employment, some weeks of voluntary part-time work, or a family structure that increases the risk of poverty.
| Poverty status and work experience | Total in the labor force | 27 weeks or more in the labor force | |
|---|---|---|---|
|
Total |
50 to 52 weeks |
||
|
Total |
|||
|
Total in the labor force |
162,757 | 150,319 | 137,122 |
|
Did not work during the year |
3,701 | 2,028 | 1,649 |
|
Worked during the year |
159,056 | 148,291 | 135,473 |
|
Usual full-time workers |
126,566 | 122,314 | 114,966 |
|
Usual part-time workers |
32,490 | 25,977 | 20,508 |
|
Involuntary part-time workers |
8,454 | 7,328 | 6,261 |
|
Voluntary part-time workers |
24,036 | 18,649 | 14,246 |
|
At or above poverty level |
|||
|
Total in the labor force |
150,808 | 140,832 | 129,168 |
|
Did not work during the year |
2,199 | 1,126 | 892 |
|
Worked during the year |
148,609 | 139,706 | 128,275 |
|
Usual full-time workers |
120,709 | 117,247 | 110,585 |
|
Usual part-time workers |
27,900 | 22,460 | 17,691 |
|
Involuntary part-time workers |
6,488 | 5,666 | 4,837 |
|
Voluntary part-time workers |
21,412 | 16,794 | 12,854 |
|
Below poverty level |
|||
|
Total in the labor force |
11,950 | 9,487 | 7,954 |
|
Did not work during the year |
1,503 | 902 | 756 |
|
Worked during the year |
10,447 | 8,585 | 7,198 |
|
Usual full-time workers |
5,857 | 5,067 | 4,381 |
|
Usual part-time workers |
4,591 | 3,518 | 2,817 |
|
Involuntary part-time workers |
1,966 | 1,662 | 1,424 |
|
Voluntary part-time workers |
2,625 | 1,855 | 1,393 |
|
Rate1 |
|||
|
Total in the labor force |
7.3 | 6.3 | 5.8 |
|
Did not work during the year |
40.6 | 44.5 | 45.9 |
|
Worked during the year |
6.6 | 5.8 | 5.3 |
|
Usual full-time workers |
4.6 | 4.1 | 3.8 |
|
Usual part-time workers |
14.1 | 13.5 | 13.7 |
|
Involuntary part-time workers |
23.3 | 22.7 | 22.7 |
|
Voluntary part-time workers |
10.9 | 9.9 | 9.8 |
|
1Number below the poverty level as a percentage of the total in the labor force. Source: U.S. Bureau of Labor Statistics, Current Population Survey (CPS), Annual Social and Economic Supplement (ASEC). |
|||
| Age and gender | Total | White | Black or African American | Asian | Hispanic or Latino ethnicity | Below poverty level | Rate1 | ||||||||
|---|---|---|---|---|---|---|---|---|---|---|---|---|---|---|---|
|
Total |
White |
Black or African American |
Asian |
Hispanic or Latino ethnicity |
Total |
White |
Black or African American |
Asian |
Hispanic or Latino ethnicity | ||||||
|
Total, 16 years and older |
150,319 | 118,831 | 18,076 | 8,747 | 24,335 | 9,487 | 6,503 | 2,112 | 379 | 2,843 | 6.3 | 5.5 | 11.7 | 4.3 | 11.7 |
|
16 to 19 years |
3,303 | 2,581 | 414 | 118 | 687 | 343 | 235 | 71 | 10 | 88 | 10.4 | 9.1 | 17.1 | 8.7 | 12.8 |
|
20 to 24 years |
13,234 | 10,129 | 1,959 | 544 | 2,816 | 1,605 | 1,140 | 367 | 39 | 363 | 12.1 | 11.2 | 18.8 | 7.2 | 12.9 |
|
25 to 34 years |
33,239 | 25,397 | 4,420 | 2,181 | 6,513 | 2,762 | 1,757 | 722 | 101 | 872 | 8.3 | 6.9 | 16.3 | 4.6 | 13.4 |
|
35 to 44 years |
31,936 | 24,516 | 4,084 | 2,213 | 6,161 | 2,134 | 1,468 | 453 | 95 | 818 | 6.7 | 6.0 | 11.1 | 4.3 | 13.3 |
|
45 to 54 years |
33,356 | 26,653 | 3,930 | 1,954 | 4,901 | 1,597 | 1,113 | 321 | 96 | 488 | 4.8 | 4.2 | 8.2 | 4.9 | 10.0 |
|
55 to 64 years |
26,139 | 21,707 | 2,587 | 1,335 | 2,564 | 864 | 647 | 149 | 30 | 180 | 3.3 | 3.0 | 5.7 | 2.2 | 7.0 |
|
65 years and older |
9,110 | 7,847 | 681 | 402 | 693 | 181 | 144 | 29 | 8 | 33 | 2.0 | 1.8 | 4.2 | 1.9 | 4.8 |
|
Men, 16 years and older |
80,139 | 64,664 | 8,430 | 4,659 | 14,130 | 4,409 | 3,290 | 705 | 191 | 1,561 | 5.5 | 5.1 | 8.4 | 4.1 | 11.1 |
|
16 to 19 years |
1,576 | 1,259 | 185 | 49 | 356 | 140 | 110 | 22 | 3 | 40 | 8.9 | 8.7 | 11.7 | (2) | 11.1 |
|
20 to 24 years |
6,842 | 5,333 | 937 | 284 | 1,579 | 623 | 484 | 105 | 18 | 171 | 9.1 | 9.1 | 11.2 | 6.5 | 10.9 |
|
25 to 34 years |
18,120 | 14,164 | 2,096 | 1,182 | 3,946 | 1,265 | 873 | 247 | 58 | 460 | 7.0 | 6.2 | 11.8 | 4.9 | 11.7 |
|
35 to 44 years |
17,218 | 13,562 | 1,894 | 1,179 | 3,647 | 1,093 | 837 | 154 | 41 | 509 | 6.3 | 6.2 | 8.1 | 3.5 | 13.9 |
|
45 to 54 years |
17,632 | 14,378 | 1,796 | 1,046 | 2,762 | 811 | 595 | 128 | 55 | 270 | 4.6 | 4.1 | 7.1 | 5.2 | 9.8 |
|
55 to 64 years |
13,749 | 11,586 | 1,213 | 693 | 1,457 | 386 | 313 | 42 | 14 | 93 | 2.8 | 2.7 | 3.5 | 2.0 | 6.4 |
|
65 years and older |
5,001 | 4,383 | 310 | 226 | 383 | 91 | 79 | 7 | 3 | 18 | 1.8 | 1.8 | 2.4 | 1.3 | 4.7 |
|
Women, 16 years and older |
70,180 | 54,167 | 9,645 | 4,088 | 10,206 | 5,078 | 3,213 | 1,407 | 187 | 1,282 | 7.2 | 5.9 | 14.6 | 4.6 | 12.6 |
|
16 to 19 years |
1,728 | 1,323 | 229 | 69 | 331 | 203 | 125 | 49 | 8 | 49 | 11.8 | 9.4 | 21.5 | (2) | 14.7 |
|
20 to 24 years |
6,392 | 4,797 | 1,022 | 259 | 1,237 | 982 | 656 | 262 | 21 | 191 | 15.4 | 13.7 | 25.7 | 7.9 | 15.5 |
|
25 to 34 years |
15,119 | 11,233 | 2,324 | 998 | 2,567 | 1,497 | 884 | 476 | 43 | 412 | 9.9 | 7.9 | 20.5 | 4.3 | 16.1 |
|
35 to 44 years |
14,718 | 10,954 | 2,190 | 1,034 | 2,514 | 1,041 | 631 | 299 | 54 | 310 | 7.1 | 5.8 | 13.6 | 5.3 | 12.3 |
|
45 to 54 years |
15,724 | 12,275 | 2,134 | 909 | 2,139 | 786 | 518 | 193 | 42 | 218 | 5.0 | 4.2 | 9.0 | 4.6 | 10.2 |
|
55 to 64 years |
12,390 | 10,121 | 1,375 | 641 | 1,107 | 479 | 334 | 106 | 16 | 87 | 3.9 | 3.3 | 7.7 | 2.5 | 7.8 |
|
65 years and older |
4,109 | 3,465 | 371 | 177 | 310 | 91 | 65 | 21 | 4 | 15 | 2.2 | 1.9 | 5.8 | 2.5 | 4.9 |
|
1Number below the poverty level as a percent of the total in the labor force for 27 weeks or more. 2Data not shown where base is less than 80,000. Note: Estimates for the race groups shown (White, Black or African American, and Asian) do not sum to totals because data are not presented for all races. People whose ethnicity is identified as Hispanic or Latino may be of any race. Source: U.S. Bureau of Labor Statistics, Current Population Survey (CPS), Annual Social and Economic Supplement (ASEC). |
|||||||||||||||
| Educational attainment, race, and Hispanic or Latino ethnicity | Total | Men | Women | Below poverty level | Rate1 | ||||
|---|---|---|---|---|---|---|---|---|---|
| Total | Men | Women | Total | Men | Women | ||||
|
Total, 16 years and older |
150,319 | 80,139 | 70,180 | 9,487 | 4,409 | 5,078 | 6.3 | 5.5 | 7.2 |
|
Less than a high school diploma |
13,054 | 8,216 | 4,838 | 2,395 | 1,373 | 1,022 | 18.3 | 16.7 | 21.1 |
|
Less than 1 year of high school |
4,336 | 2,882 | 1,453 | 833 | 521 | 312 | 19.2 | 18.1 | 21.5 |
|
1–3 years of high school |
6,707 | 4,088 | 2,619 | 1,230 | 653 | 577 | 18.3 | 16.0 | 22.0 |
|
4 years of high school, no diploma |
2,012 | 1,246 | 765 | 332 | 199 | 133 | 16.5 | 16.0 | 17.4 |
|
High school graduates, no college2 |
40,825 | 23,770 | 17,055 | 3,403 | 1,571 | 1,832 | 8.3 | 6.6 | 10.7 |
|
Some college or associate’s degree |
43,572 | 21,470 | 22,102 | 2,642 | 961 | 1,682 | 6.1 | 4.5 | 7.6 |
|
Some college, no degree |
27,804 | 14,159 | 13,644 | 1,914 | 725 | 1,189 | 6.9 | 5.1 | 8.7 |
|
Associate’s degree |
15,768 | 7,311 | 8,458 | 729 | 236 | 493 | 4.6 | 3.2 | 5.8 |
|
Bachelor’s degree and higher3 |
52,868 | 26,682 | 26,186 | 1,047 | 505 | 542 | 2.0 | 1.9 | 2.1 |
|
White, 16 years and older |
118,831 | 64,664 | 54,167 | 6,503 | 3,290 | 3,213 | 5.5 | 5.1 | 5.9 |
|
Less than a high school diploma |
10,429 | 6,799 | 3,629 | 1,846 | 1,123 | 723 | 17.7 | 16.5 | 19.9 |
|
Less than 1 year of high school |
3,731 | 2,538 | 1,193 | 719 | 455 | 264 | 19.3 | 17.9 | 22.2 |
|
1–3 years of high school |
5,213 | 3,300 | 1,913 | 892 | 521 | 372 | 17.1 | 15.8 | 19.4 |
|
4 years of high school, no diploma |
1,485 | 962 | 523 | 235 | 148 | 87 | 15.8 | 15.3 | 16.7 |
|
High school graduates, no college2 |
32,123 | 19,175 | 12,948 | 2,181 | 1,113 | 1,068 | 6.8 | 5.8 | 8.3 |
|
Some college or associate’s degree |
34,133 | 17,217 | 16,916 | 1,698 | 658 | 1,041 | 5.0 | 3.8 | 6.2 |
|
Some college, no degree |
21,400 | 11,162 | 10,238 | 1,212 | 488 | 724 | 5.7 | 4.4 | 7.1 |
|
Associate’s degree |
12,733 | 6,055 | 6,677 | 487 | 170 | 317 | 3.8 | 2.8 | 4.7 |
|
Bachelor’s degree and higher3 |
42,146 | 21,472 | 20,674 | 777 | 397 | 380 | 1.8 | 1.8 | 1.8 |
|
Black or African American, 16 years and older |
18,076 | 8,430 | 9,645 | 2,112 | 705 | 1,407 | 11.7 | 8.4 | 14.6 |
|
Less than a high school diploma |
1,418 | 737 | 680 | 327 | 129 | 198 | 23.1 | 17.5 | 29.1 |
|
Less than 1 year of high school |
196 | 110 | 86 | 36 | 22 | 14 | 18.3 | 20.1 | 16.1 |
|
1–3 years of high school |
877 | 449 | 428 | 217 | 73 | 144 | 24.8 | 16.3 | 33.6 |
|
4 years of high school, no diploma |
344 | 178 | 166 | 74 | 34 | 40 | 21.6 | 19.1 | 24.2 |
|
High school graduates, no college2 |
5,832 | 3,036 | 2,796 | 941 | 325 | 616 | 16.1 | 10.7 | 22 |
|
Some college or associate’s degree |
6,251 | 2,667 | 3,584 | 702 | 210 | 492 | 11.2 | 7.9 | 13.7 |
|
Some college, no degree |
4,289 | 1,933 | 2,356 | 509 | 162 | 347 | 11.9 | 8.4 | 14.7 |
|
Associate’s degree |
1,962 | 734 | 1,228 | 193 | 48 | 144 | 9.8 | 6.6 | 11.8 |
|
Bachelor’s degree and higher3 |
4,575 | 1,990 | 2,585 | 142 | 41 | 101 | 3.1 | 2.1 | 3.9 |
|
Asian, 16 years and older |
8,747 | 4,659 | 4,088 | 379 | 191 | 187 | 4.3 | 4.1 | 4.6 |
|
Less than a high school diploma |
581 | 290 | 291 | 103 | 51 | 52 | 17.7 | 17.4 | 18 |
|
Less than 1 year of high school |
233 | 111 | 122 | 43 | 21 | 23 | 18.7 | 18.8 | 18.5 |
|
1–3 years of high school |
250 | 126 | 124 | 50 | 24 | 26 | 19.8 | 18.9 | 20.8 |
|
4 years of high school, no diploma |
97 | 53 | 44 | 10 | 6 | 4 | 10.1 | (4) | (4) |
|
High school graduates, no college2 |
1,515 | 807 | 708 | 106 | 58 | 48 | 7.0 | 7.1 | 6.8 |
|
Some college or associate’s degree |
1,623 | 840 | 783 | 75 | 31 | 43 | 4.6 | 3.7 | 5.5 |
|
Some college, no degree |
1,023 | 550 | 473 | 61 | 25 | 35 | 5.9 | 4.6 | 7.5 |
|
Associate’s degree |
600 | 290 | 310 | 14 | 6 | 8 | 2.4 | 2.1 | 2.6 |
|
Bachelor’s degree and higher3 |
5,028 | 2,721 | 2,306 | 95 | 52 | 43 | 1.9 | 1.9 | 1.9 |
|
Hispanic or Latino ethnicity, 16 years and older |
24,335 | 14,130 | 10,206 | 2,843 | 1,561 | 1,282 | 11.7 | 11.1 | 12.6 |
|
Less than a high school diploma |
6,611 | 4,414 | 2,197 | 1,334 | 820 | 514 | 20.2 | 18.6 | 23.4 |
|
Less than 1 year of high school |
3,333 | 2,275 | 1,058 | 670 | 417 | 253 | 20.1 | 18.3 | 23.9 |
|
1–3 years of high school |
2,549 | 1,658 | 891 | 537 | 321 | 217 | 21.1 | 19.3 | 24.3 |
|
4 years of high school, no diploma |
730 | 481 | 248 | 127 | 82 | 45 | 17.4 | 17.1 | 18 |
|
High school graduates, no college2 |
7,664 | 4,618 | 3,045 | 918 | 486 | 433 | 12.0 | 10.5 | 14.2 |
|
Some college or associate’s degree |
6,148 | 3,160 | 2,988 | 442 | 189 | 253 | 7.2 | 6.0 | 8.5 |
|
Some college, no degree |
4,225 | 2,195 | 2,030 | 319 | 134 | 184 | 7.5 | 6.1 | 9.1 |
|
Associate’s degree |
1,923 | 965 | 958 | 123 | 54 | 69 | 6.4 | 5.6 | 7.2 |
|
Bachelor’s degree and higher3 |
3,912 | 1,937 | 1,975 | 149 | 67 | 82 | 3.8 | 3.5 | 4.1 |
|
1Number below the poverty level as a percent of the total in the labor force for 27 weeks or more. 2Includes people with a high school diploma or equivalent. 3Includes people with bachelor’s, master’s, professional, and doctoral degrees. 4Data not shown where base is less than 80,000. Note: Estimates for the race groups shown (White, Black or African American, and Asian) do not sum to totals because data are not presented for all races. People whose ethnicity is identified as Hispanic or Latino may be of any race. Dash represents or rounds to zero. Source: U.S. Bureau of Labor Statistics, Current Population Survey (CPS), Annual Social and Economic Supplement (ASEC). |
|||||||||
| Occupation, race, and Hispanic or Latino ethnicity | Total | Men | Women | Below poverty level | Rate1 | ||||
|---|---|---|---|---|---|---|---|---|---|
| Total | Men | Women | Total | Men | Women | ||||
|
Total, 16 years and older2 |
148,291 | 78,985 | 69,306 | 8,585 | 3,943 | 4,642 | 5.8 | 5.0 | 6.7 |
|
Management, professional, and related occupations |
56,949 | 27,538 | 29,411 | 1,107 | 484 | 623 | 1.9 | 1.8 | 2.1 |
|
Management, business, and financial operations occupations |
23,807 | 13,542 | 10,265 | 486 | 263 | 223 | 2.0 | 1.9 | 2.2 |
|
Professional and related occupations |
33,143 | 13,997 | 19,146 | 621 | 221 | 399 | 1.9 | 1.6 | 2.1 |
|
Service occupations |
25,017 | 10,792 | 14,224 | 3,202 | 1,065 | 2,138 | 12.8 | 9.9 | 15.0 |
|
Sales and office occupations |
34,133 | 13,186 | 20,947 | 1,996 | 619 | 1,377 | 5.8 | 4.7 | 6.6 |
|
Sales and related occupations |
15,961 | 8,017 | 7,944 | 1,263 | 375 | 887 | 7.9 | 4.7 | 11.2 |
|
Office and administrative support occupations |
18,172 | 5,169 | 13,003 | 733 | 243 | 490 | 4.0 | 4.7 | 3.8 |
|
Natural resources, construction, and maintenance occupations |
14,100 | 13,443 | 658 | 1,113 | 1,041 | 72 | 7.9 | 7.7 | 11.0 |
|
Farming, fishing, and forestry occupations |
1,104 | 842 | 262 | 186 | 142 | 44 | 16.8 | 16.8 | 16.8 |
|
Construction and extraction occupations |
7,978 | 7,775 | 203 | 686 | 671 | 15 | 8.6 | 8.6 | 7.4 |
|
Installation, maintenance, and repair occupations |
5,018 | 4,825 | 193 | 241 | 228 | 13 | 4.8 | 4.7 | 6.8 |
|
Production, transportation, and material-moving occupations |
17,952 | 13,917 | 4,035 | 1,161 | 729 | 432 | 6.5 | 5.2 | 10.7 |
|
Production occupations |
8,726 | 6,176 | 2,550 | 562 | 310 | 252 | 6.4 | 5.0 | 9.9 |
|
Transportation and material-moving occupations |
9,226 | 7,741 | 1,484 | 599 | 419 | 180 | 6.5 | 5.4 | 12.1 |
|
White, 16 years and older2 |
117,553 | 63,917 | 53,635 | 5,962 | 2,991 | 2,971 | 5.1 | 4.7 | 5.5 |
|
Management, professional, and related occupations |
46,224 | 22,718 | 23,507 | 836 | 388 | 448 | 1.8 | 1.7 | 1.9 |
|
Management, business, and financial operations occupations |
19,861 | 11,637 | 8,223 | 380 | 216 | 164 | 1.9 | 1.9 | 2.0 |
|
Professional and related occupations |
26,364 | 11,080 | 15,284 | 456 | 172 | 284 | 1.7 | 1.6 | 1.9 |
|
Service occupations |
18,278 | 7,971 | 10,307 | 2,072 | 764 | 1,309 | 11.3 | 9.6 | 12.7 |
|
Sales and office occupations |
26,916 | 10,556 | 16,361 | 1,311 | 428 | 883 | 4.9 | 4.1 | 5.4 |
|
Sales and related occupations |
12,837 | 6,666 | 6,171 | 844 | 276 | 568 | 6.6 | 4.1 | 9.2 |
|
Office and administrative support occupations |
14,079 | 3,889 | 10,190 | 467 | 152 | 315 | 3.3 | 3.9 | 3.1 |
|
Natural resources, construction, and maintenance occupations |
12,341 | 11,818 | 523 | 952 | 895 | 58 | 7.7 | 7.6 | 11.0 |
|
Farming, fishing, and forestry occupations |
982 | 762 | 219 | 161 | 124 | 37 | 16.4 | 16.2 | 17.0 |
|
Construction and extraction occupations |
6,997 | 6,836 | 160 | 587 | 578 | 9 | 8.4 | 8.5 | 5.4 |
|
Installation, maintenance, and repair occupations |
4,363 | 4,219 | 143 | 204 | 192 | 12 | 4.7 | 4.6 | 8.3 |
|
Production, transportation, and material-moving occupations |
13,695 | 10,773 | 2,923 | 785 | 511 | 275 | 5.7 | 4.7 | 9.4 |
|
Production occupations |
6,805 | 4,991 | 1,814 | 373 | 220 | 152 | 5.5 | 4.4 | 8.4 |
|
Transportation and material-moving occupations |
6,890 | 5,782 | 1,108 | 413 | 291 | 122 | 6.0 | 5.0 | 11.0 |
|
Black or African American, 16 years and older2 |
17,521 | 8,138 | 9,383 | 1,824 | 582 | 1,242 | 10.4 | 7.2 | 13.2 |
|
Management, professional, and related occupations |
5,114 | 1,942 | 3,171 | 167 | 42 | 125 | 3.3 | 2.2 | 3.9 |
|
Management, business, and financial operations occupations |
1,936 | 871 | 1,066 | 66 | 23 | 43 | 3.4 | 2.6 | 4.0 |
|
Professional and related occupations |
3,177 | 1,071 | 2,106 | 102 | 20 | 82 | 3.2 | 1.8 | 3.9 |
|
Service occupations |
4,268 | 1,749 | 2,519 | 819 | 193 | 626 | 19.2 | 11.0 | 24.8 |
|
Sales and office occupations |
4,355 | 1,426 | 2,929 | 486 | 117 | 370 | 11.2 | 8.2 | 12.6 |
|
Sales and related occupations |
1,728 | 678 | 1,050 | 304 | 60 | 244 | 17.6 | 8.9 | 23.3 |
|
Office and administrative support occupations |
2,627 | 748 | 1,879 | 182 | 56 | 125 | 6.9 | 7.5 | 6.7 |
|
Natural resources, construction, and maintenance occupations |
977 | 894 | 83 | 89 | 80 | 9 | 9.1 | 9.0 | 10.3 |
|
Farming, fishing, and forestry occupations |
59 | 40 | 19 | 12 | 9 | 3 | 20.0 | (3) | (3) |
|
Construction and extraction occupations |
575 | 544 | 31 | 61 | 57 | 4 | 10.7 | 10.5 | (3) |
|
Installation, maintenance, and repair occupations |
343 | 310 | 33 | 15 | 14 | 1 | 4.5 | 4.6 | (3) |
|
Production, transportation, and material-moving occupations |
2,781 | 2,105 | 675 | 263 | 150 | 113 | 9.5 | 7.1 | 16.8 |
|
Production occupations |
1,120 | 723 | 397 | 130 | 61 | 68 | 11.6 | 8.5 | 17.2 |
|
Transportation and material-moving occupations |
1,660 | 1,382 | 278 | 134 | 89 | 45 | 8.1 | 6.4 | 16.2 |
|
Asian, 16 years and older2 |
8,667 | 4,611 | 4,055 | 359 | 182 | 177 | 4.1 | 3.9 | 4.4 |
|
Management, professional, and related occupations |
4,332 | 2,339 | 1,993 | 66 | 37 | 29 | 1.5 | 1.6 | 1.5 |
|
Management, business, and financial operations occupations |
1,490 | 789 | 701 | 22 | 13 | 9 | 1.5 | 1.6 | 1.4 |
|
Professional and related occupations |
2,842 | 1,551 | 1,291 | 44 | 24 | 20 | 1.5 | 1.5 | 1.5 |
|
Service occupations |
1,382 | 590 | 793 | 111 | 36 | 75 | 8.0 | 6.1 | 9.5 |
|
Sales and office occupations |
1,760 | 808 | 952 | 93 | 47 | 46 | 5.3 | 5.8 | 4.8 |
|
Sales and related occupations |
908 | 478 | 430 | 55 | 30 | 24 | 6.0 | 6.4 | 5.6 |
|
Office and administrative support occupations |
851 | 330 | 522 | 38 | 17 | 22 | 4.5 | 5.0 | 4.1 |
|
Natural resources, construction, and maintenance occupations |
312 | 293 | 19 | 20 | 18 | 2 | 6.5 | 6.3 | (3) |
|
Farming, fishing, and forestry occupations |
26 | 15 | 11 | 7 | 5 | 2 | (3) | (3) | (3) |
|
Construction and extraction occupations |
122 | 121 | 1 | 8 | 8 | – | (3) | (3) | (3) |
|
Installation, maintenance, and repair occupations |
165 | 158 | 7 | 6 | 6 | – | 3.6 | 3.8 | (3) |
|
Production, transportation, and material-moving occupations |
876 | 579 | 297 | 69 | 44 | 25 | 7.8 | 7.6 | 8.4 |
|
Production occupations |
534 | 284 | 250 | 36 | 16 | 20 | 6.8 | 5.7 | 8.0 |
|
Transportation and material-moving occupations |
342 | 295 | 47 | 32 | 28 | 5 | 9.5 | 9.3 | (3) |
|
Hispanic or Latino ethnicity, 16 years and older2 |
23,951 | 13,917 | 10,034 | 2,647 | 1,462 | 1,185 | 11.1 | 10.5 | 11.8 |
|
Management, professional, and related occupations |
4,889 | 2,289 | 2,600 | 176 | 81 | 95 | 3.6 | 3.5 | 3.7 |
|
Management, business, and financial operations occupations |
2,148 | 1,163 | 986 | 95 | 54 | 41 | 4.4 | 4.6 | 4.2 |
|
Professional and related occupations |
2,740 | 1,126 | 1,614 | 81 | 27 | 54 | 3.0 | 2.4 | 3.4 |
|
Service occupations |
5,866 | 2,684 | 3,182 | 1,057 | 456 | 601 | 18.0 | 17.0 | 18.9 |
|
Sales and office occupations |
5,086 | 2,036 | 3,050 | 443 | 140 | 302 | 8.7 | 6.9 | 9.9 |
|
Sales and related occupations |
2,349 | 1,093 | 1,256 | 282 | 77 | 204 | 12.0 | 7.1 | 16.2 |
|
Office and administrative support occupations |
2,737 | 943 | 1,793 | 161 | 63 | 98 | 5.9 | 6.7 | 5.5 |
|
Natural resources, construction, and maintenance occupations |
4,083 | 3,859 | 224 | 576 | 547 | 29 | 14.1 | 14.2 | 12.9 |
|
Farming, fishing, and forestry occupations |
562 | 431 | 132 | 105 | 82 | 23 | 18.7 | 19 | 17.5 |
|
Construction and extraction occupations |
2,605 | 2,533 | 72 | 387 | 383 | 4 | 14.9 | 15.1 | (3) |
|
Installation, maintenance, and repair occupations |
916 | 895 | 21 | 84 | 82 | 2 | 9.2 | 9.2 | (3) |
|
Production, transportation, and material-moving occupations |
4,009 | 3,036 | 972 | 395 | 239 | 157 | 9.9 | 7.9 | 16.1 |
|
Production occupations |
1,926 | 1,291 | 635 | 184 | 94 | 90 | 9.6 | 7.3 | 14.2 |
|
Transportation and material-moving occupations |
2,082 | 1,746 | 337 | 211 | 145 | 66 | 10.1 | 8.3 | 19.7 |
|
1Number below the poverty level as a percent of the total in the labor force for 27 weeks or more who worked during the year. 2Estimates for the occupational groups do not sum to totals because data includes the long-term unemployed with no previous work experience and a small number of people whose last job was in the Armed Forces. 3Data not shown where base is less than 80,000. Note: Estimates for the race groups shown (White, Black or African American, and Asian) do not sum to totals because data are not presented for all races. People whose ethnicity is identified as Hispanic or Latino may be of any race. Dash represents or rounds to zero. Source: U.S. Bureau of Labor Statistics, Current Population Survey (CPS), Annual Social and Economic Supplement (ASEC). |
|||||||||
| Characteristic | Total families | At or above poverty level |
Below poverty level |
Rate1 |
|---|---|---|---|---|
|
Total primary families |
66,732 | 61,624 | 5,108 | 7.7 |
|
With related children under 18 years |
35,145 | 30,897 | 4,248 | 12.1 |
|
Without children |
31,587 | 30,726 | 860 | 2.7 |
|
With one member in the labor force |
28,974 | 24,659 | 4,315 | 14.9 |
|
With two or more members in the labor force |
37,758 | 36,965 | 793 | 2.1 |
|
With two members |
31,366 | 30,641 | 725 | 2.3 |
|
With three or more members |
6,393 | 6,324 | 69 | 1.1 |
|
Married-couple families |
49,325 | 47,215 | 2,110 | 4.3 |
|
With related children under 18 years |
24,555 | 22,891 | 1,664 | 6.8 |
|
Without children |
24,770 | 24,324 | 446 | 1.8 |
|
With one member in the labor force |
17,162 | 15,570 | 1,592 | 9.3 |
|
Husband |
12,276 | 11,048 | 1,228 | 10.0 |
|
Wife |
4,209 | 3,917 | 292 | 6.9 |
|
Relative |
676 | 605 | 72 | 10.6 |
|
With two or more members in the labor force |
32,163 | 31,645 | 518 | 1.6 |
|
With two members |
27,024 | 26,537 | 486 | 1.8 |
|
With three or more members |
5,140 | 5,108 | 32 | 0.6 |
|
Families maintained by women |
12,148 | 9,702 | 2,445 | 20.1 |
|
With related children under 18 years |
7,946 | 5,784 | 2,162 | 27.2 |
|
Without children |
4,202 | 3,918 | 283 | 6.7 |
|
With one member in the labor force |
8,543 | 6,317 | 2,226 | 26.1 |
|
Householder |
6,982 | 5,040 | 1,942 | 27.8 |
|
Relative |
1,561 | 1,277 | 283 | 18.2 |
|
With two or more members in the labor force |
3,605 | 3,386 | 219 | 6.1 |
|
Families maintained by men |
5,259 | 4,706 | 553 | 10.5 |
|
With related children under 18 years |
2,644 | 2,222 | 422 | 16.0 |
|
Without children |
2,615 | 2,484 | 131 | 5.0 |
|
With one member in the labor force |
3,269 | 2,772 | 497 | 15.2 |
|
Householder |
2,667 | 2,240 | 427 | 16.0 |
|
Relative |
602 | 532 | 70 | 11.6 |
|
With two or more members in the labor force |
1,990 | 1,934 | 56 | 2.8 |
|
1Number below the poverty level as a percent of the total in the labor force for 27 weeks or more. Note: Data relate to primary families with at least one member in the labor force for 27 weeks or more. Source: U.S. Bureau of Labor Statistics, Current Population Survey (CPS), Annual Social and Economic Supplement (ASEC). |
||||
| Poverty status and work experience | Total people | In married-couple families | In families maintained by women | In families maintained by men | Unrelated individuals | |||||||
|---|---|---|---|---|---|---|---|---|---|---|---|---|
| Hus- bands |
Wives | Related children under 18 years | Other relatives | House- holder |
Related children under 18 years | Other relatives | House- holder |
Related children under 18 years | Other relatives | |||
|
Total |
||||||||||||
|
All people1 |
250,080 | 59,362 | 59,951 | 5,573 | 21,458 | 15,516 | 2,161 | 14,168 | 6,125 | 644 | 6,465 | 58,657 |
|
With labor force activity |
162,757 | 45,113 | 37,048 | 1,335 | 13,485 | 10,756 | 388 | 8,476 | 4,685 | 142 | 3,994 | 37,336 |
|
1 to 26 weeks |
12,438 | 1,571 | 2,730 | 776 | 2,412 | 624 | 235 | 1,095 | 254 | 81 | 342 | 2,318 |
|
27 weeks or more |
150,319 | 43,542 | 34,318 | 558 | 11,073 | 10,131 | 153 | 7,381 | 4,431 | 61 | 3,652 | 35,018 |
|
With no labor force activity |
87,323 | 14,249 | 22,903 | 4,239 | 7,973 | 4,760 | 1,773 | 5,691 | 1,439 | 502 | 2,471 | 21,321 |
|
At or above poverty level |
||||||||||||
|
All people1 |
217,643 | 55,667 | 56,220 | 5,177 | 20,374 | 10,760 | 1,426 | 11,518 | 5,164 | 532 | 5,773 | 45,032 |
|
With labor force activity |
150,808 | 43,249 | 36,118 | 1,302 | 13,129 | 8,233 | 319 | 7,580 | 4,140 | 131 | 3,810 | 32,798 |
|
1 to 26 weeks |
9,975 | 1,423 | 2,515 | 754 | 2,305 | 236 | 183 | 823 | 183 | 71 | 308 | 1,175 |
|
27 weeks or more |
140,832 | 41,826 | 33,603 | 548 | 10,824 | 7,996 | 136 | 6,757 | 3,957 | 60 | 3,502 | 31,623 |
|
With no labor force activity |
66,835 | 12,418 | 20,102 | 3,875 | 7,245 | 2,528 | 1,107 | 3,938 | 1,024 | 401 | 1,963 | 12,234 |
|
Below poverty level |
||||||||||||
|
All people1 |
32,437 | 3,695 | 3,732 | 396 | 1,084 | 4,756 | 735 | 2,649 | 961 | 112 | 692 | 13,625 |
|
With labor force activity |
11,950 | 1,864 | 930 | 33 | 356 | 2,523 | 69 | 896 | 545 | 11 | 184 | 4,538 |
|
1 to 26 weeks |
2,463 | 149 | 216 | 23 | 108 | 388 | 51 | 271 | 72 | 9 | 34 | 1,143 |
|
27 weeks or more |
9,487 | 1,715 | 715 | 10 | 248 | 2,135 | 18 | 625 | 474 | 1 | 150 | 3,395 |
|
With no labor force activity |
20,488 | 1,831 | 2,801 | 363 | 728 | 2,232 | 666 | 1,753 | 415 | 102 | 509 | 9,087 |
|
Rate2 |
||||||||||||
|
All people1 |
13.0 | 6.2 | 6.2 | 7.1 | 5.1 | 30.7 | 34.0 | 18.7 | 15.7 | 17.4 | 10.7 | 23.2 |
|
With labor force activity |
7.3 | 4.1 | 2.5 | 2.5 | 2.6 | 23.5 | 17.8 | 10.6 | 11.6 | 7.6 | 4.6 | 12.2 |
|
1 to 26 weeks |
19.8 | 9.5 | 7.9 | 2.9 | 4.5 | 62.1 | 21.9 | 24.8 | 28.1 | 11.6 | 9.9 | 49.3 |
|
27 weeks or more |
6.3 | 3.9 | 2.1 | 1.8 | 2.2 | 21.1 | 11.5 | 8.5 | 10.7 | (3) | 4.1 | 9.7 |
|
With no labor force activity |
23.5 | 12.9 | 12.2 | 8.6 | 9.1 | 46.9 | 37.6 | 30.8 | 28.9 | 20.2 | 20.6 | 42.6 |
|
1Data on families include primary families that own or rent the housing unit as well as related and unrelated subfamilies that reside with them. 2Number below the poverty level as a percent of the total. 3Data not shown where base is less than 80,000. Source: U.S. Bureau of Labor Statistics, Current Population Survey (CPS), Annual Social and Economic Supplement (ASEC). |
||||||||||||
| Characteristic | Total | At or above poverty level |
Below poverty level |
Rate1 |
|---|---|---|---|---|
|
Age and gender |
||||
|
Total unrelated individuals |
35,018 | 31,623 | 3,395 | 9.7 |
|
16 to 19 years |
390 | 248 | 142 | 36.5 |
|
20 to 24 years |
4,128 | 3,340 | 788 | 19.1 |
|
25 to 64 years |
28,034 | 25,649 | 2,385 | 8.5 |
|
65 years and older |
2,465 | 2,385 | 80 | 3.2 |
|
Men |
19,244 | 17,577 | 1,667 | 8.7 |
|
Women |
15,774 | 14,045 | 1,728 | 11.0 |
|
Race and Hispanic or Latino ethnicity |
||||
|
White |
27,538 | 25,059 | 2,479 | 9.0 |
|
Men |
15,205 | 13,977 | 1,228 | 8.1 |
|
Women |
12,333 | 11,082 | 1,250 | 10.1 |
|
Black or African American |
4,865 | 4,198 | 667 | 13.7 |
|
Men |
2,568 | 2,251 | 317 | 12.3 |
|
Women |
2,297 | 1,947 | 350 | 15.3 |
|
Asian |
1,509 | 1,414 | 95 | 6.3 |
|
Men |
835 | 799 | 36 | 4.3 |
|
Women |
674 | 615 | 59 | 8.7 |
|
Hispanic or Latino ethnicity |
4,835 | 4,163 | 673 | 13.9 |
|
Men |
3,203 | 2,812 | 390 | 12.2 |
|
Women |
1,632 | 1,350 | 282 | 17.3 |
|
Living arrangement |
||||
|
Living alone |
18,032 | 16,721 | 1,311 | 7.3 |
|
Living with others |
16,986 | 14,902 | 2,085 | 12.3 |
|
1Number below the poverty level as a percent of the total in the labor force for 27 weeks or more. People whose ethnicity is identified as Hispanic or Latino may be of any race. Note: Estimates for the race groups shown (White, Black or African American, and Asian) do not sum to totals because data are not presented for all races. Source: U.S. Bureau of Labor Statistics, Current Population Survey (CPS), Annual Social and Economic Supplement (ASEC). |
||||
| Labor market problems | Total | At or above poverty level |
Below poverty level |
Rate1 |
|---|---|---|---|---|
|
Total, full-time wage and salary workers |
116,175 | 111,728 | 4,447 | 3.8 |
|
No unemployment, involuntary part-time employment, or low earnings2 |
96,090 | 95,271 | 819 | 0.9 |
|
Unemployment only |
5,291 | 4,820 | 471 | 8.9 |
|
Involuntary part-time employment only |
2,681 | 2,596 | 85 | 3.2 |
|
Low earnings only |
8,289 | 6,440 | 1,849 | 22.3 |
|
Unemployment and involuntary part-time employment |
1,059 | 973 | 86 | 8.2 |
|
Unemployment and low earnings |
1,561 | 853 | 708 | 45.3 |
|
Involuntary part-time employment and low earnings |
814 | 556 | 258 | 31.7 |
|
Unemployment, involuntary part-time employment, and low earnings |
389 | 220 | 170 | 43.6 |
|
Unemployment (alone or with other problems) |
8,301 | 6,865 | 1,435 | 17.3 |
|
Involuntary part-time employment (alone or with other problems) |
4,944 | 4,344 | 600 | 12.1 |
|
Low earnings (alone or with other problems) |
11,053 | 8,069 | 2,985 | 27.0 |
|
1Number below the poverty level as a percent of the total in the labor force for 27 weeks or more. 2The low-earnings threshold in 2014 was $348.44 per week. Source: U.S. Bureau of Labor Statistics, Current Population Survey (CPS), Annual Social and Economic Supplement (ASEC). |
||||
The data presented in this report were collected in the Annual Social and Economic Supplement (ASEC) to the Current Population Survey (CPS). The CPS is a monthly sample survey of about 60,000 eligible households, conducted by the U.S. Census Bureau for the Bureau of Labor Statistics. Data from the CPS are used to obtain the monthly estimates of the nation’s employment and unemployment levels. The ASEC, conducted in the months of February through April, includes questions about work activity and income during the previous calendar year. For instance, data collected in 2015 refer to the 2014 calendar year.
Estimates in this report are based on a sample and, consequently, may differ from figures that would have been obtained from a complete count using the same questionnaire and procedures. Sampling variability may be relatively large in cases where the numbers are small. Thus, both small estimates and small differences between estimates should be interpreted with caution. The 2014 data in this report are based on a redesigned questionnaire aimed at improving income reporting, increasing response rates and reducing reporting errors. For a detailed explanation of the ASEC supplement to the CPS, its sampling variability, and more extensive definitions than those provided in these Technical Notes, see Income and Poverty in the United States: 2014, Current Population Reports, P60-252 (U.S. Census Bureau, September 2015). This publication is available on the U.S. Census Bureau website at https://www.census.gov/content/dam/Census/library/publications/2015/demo/p60-252.pdf, and additional information about income and poverty measures is available at https://www.census.gov/topics/income-poverty/income.html.
Material in this report is in the public domain and may be reproduced without permission.
Upon request, this information is available to individuals who are sensory-impaired. Voice phone: (202) 691-5200; Federal Relay Service: (800) 877-8339.
For more information on the data provided in this report, contact the U.S. Bureau of Labor Statistics, Division of Labor Force Statistics. Email: cpsinfo@bls.gov; Telephone: (202) 691-6378.
The data presented in this release are not strictly comparable with data for earlier years due to the introduction of updated population estimates, or controls, used in the CPS. The population controls are updated each year in January to reflect the latest information about population change. Additional information is at https://www.bls.gov/cps/documentation.htm#pop.
Prior editions of this report included estimates for years through 2012 that were affected by several errors, as described at https://www.bls.gov/bls/errata/corrected-working-poor-data.htm. These errors do not affect estimates for 2014.
Poverty classification. Poverty statistics presented in this report are based on definitions developed by the Social Security Administration in 1964 and revised by Federal interagency committees in 1969 and 1981. These definitions originally were based on the Department of Agriculture’s Economy Food Plan and reflected the different consumption requirements of families predicated on the basis of factors such as family size and the number of children under 18 years of age.
The actual poverty thresholds vary, due to the makeup of the family. In 2014, the weighted average poverty threshold for a family of four was $24,230; for a family of nine or more people, the threshold was $49,021; and for one person (unrelated individual), it was $12,071. Poverty thresholds are updated each year to reflect changes in the Consumer Price Index for All Urban Consumers (CPI-U). Thresholds do not vary geographically. (For more information, see Income and Poverty in the United States: 2014, at https://www.census.gov/content/dam/Census/library/publications/2015/demo/p60-252.pdf.)
Low earnings. The low-earnings level, as first developed in 1987, represented the average of the real value of the minimum wage between 1967 and 1987 for a 40-hour workweek. The year 1967 was chosen as the base year because that was the first year in which minimum-wage legislation covered essentially the same broad group of workers that currently is covered. The low-earnings level has been adjusted each year since then in accordance with the CPI-U, so the measure maintains the same real value that it held in 1987. In 2014, the low-earnings threshold was $348.44 per week. For a complete definition, see Bruce W. Klein and Philip L. Rones, “A profile of the working poor,” Monthly Labor Review, October 1989, pp. 3–11, at https://www.bls.gov/opub/mlr/1989/10/art1full.pdf.
Income. Data on income are limited to money income—before personal income taxes and payroll deductions—received in the calendar year preceding the CPS supplement. Data on income do not include the value of noncash benefits such as food stamps, Medicare, Medicaid, public housing, and employer-provided benefits. For a complete definition of income, see Income and Poverty in the United States: 2014, at https://www.census.gov/content/dam/Census/library/publications/2015/demo/p60-252.pdf.
Labor force. People in the labor force are those who worked or looked for work sometime during the calendar year. The number of weeks in the labor force is accumulated over the entire year. The focus in this report is on people who were in the labor force for 27 weeks or more.
Working poor. The working poor are people who spent at least 27 weeks in the labor force (that is, working or looking for work) but whose incomes still fell below the official poverty level.
Working-poor rate. This rate is the number of individuals in the labor force for at least 27 weeks whose incomes still fell below the official poverty level as a percent of all people who were in the labor force for at least 27 weeks during the calendar year.
Involuntary part-time workers. These are people who, during at least 1 week of the year, worked fewer than 35 hours because of slack work or business conditions or because they could not find full-time work. The number of weeks of involuntary part-time work is accumulated over the year.
Occupation. This term refers to the job in which a person worked the most weeks during the calendar year.
Unemployed. Unemployed people are those who looked for work while not employed or those who were on layoff from a job and were expecting to be recalled to that job. The number of weeks unemployed is accumulated over the entire year.
Family. A family is defined as a group of two or more people residing together who are related by birth, marriage, or adoption. The count of families used in this report includes only primary families. A primary family consists of the reference person (householder) and all people living in the household who are related to the reference person. Families are classified either as married-couple families or as those maintained by men or women without spouses present. Family status is determined at the time of the survey interview and, thus, may be different from that of the previous year.
Unrelated individuals. These are people who are not living with anyone related to them by birth, marriage, or adoption. Such individuals may live alone, reside in a nonrelated family household, or live in group quarters with other unrelated individuals.
Related children. Related children are children under age 18 (including sons, daughters, stepchildren, and adopted children) of the husband, wife, or person maintaining the family, as well as other children related to the householder by birth, marriage, or adoption.
Race. White, Black or African American, and Asian are categories used to describe the race of people. People in these categories are those who selected that race group only. Data for the two remaining race categories—American Indian and Alaska Native, and Native Hawaiian and Other Pacific Islander—and for people who selected more than one race category are included in totals, but are not shown separately because the number of survey respondents is too small to develop estimates of sufficient quality for publication. In the enumeration process, race is determined by the household respondent.
Hispanic or Latino ethnicity. This refers to people who identified themselves in the CPS enumeration process as being of Hispanic, Latino, or Spanish ethnicity. People whose ethnicity is identified as Hispanic or Latino may be of any race.